Hi Dear Today we will discuss trading Stretegy using EMA 20/50 crossover trading strategy.
Exponential Moving Average (EMA)?
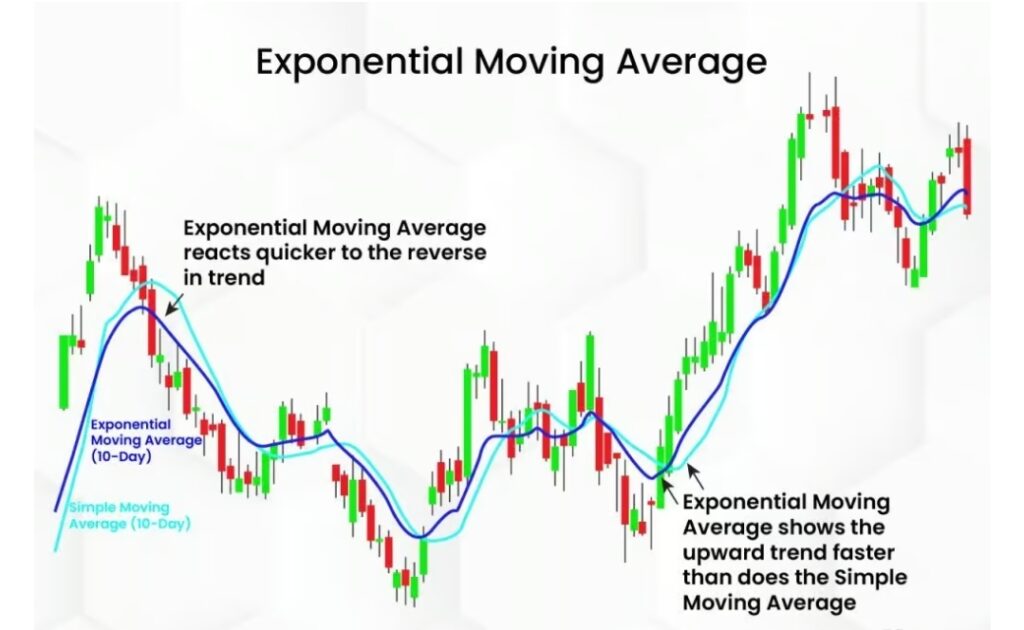
The Exponential Moving Average(EMA) is a technical chart indicator that produces buy and sell signals by tracking the price of a security over a period of time. The EMA determines buy and sell signals based on divergences and crossovers in the past average. The EMA is used for different time frames, and its signals vary with the chosen time frame. The EMA is a type of moving average indicator. The EMA gives greater significance to recent price data as compared to the Simple Moving Average.
HOW TO USE EMA 20/50 crossover
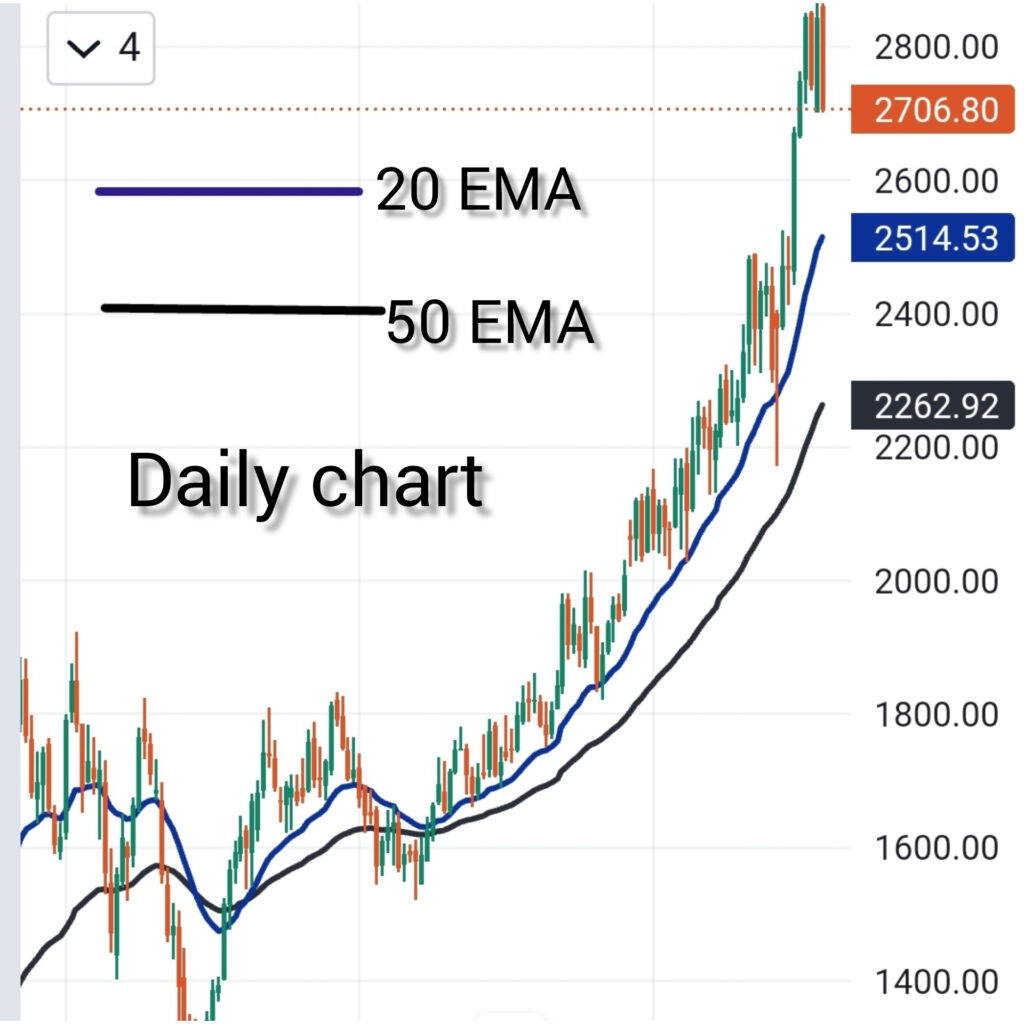
Firstly you have to check trend and pulse of stock on big time frame like weekly and daily. If EMA 20 give crossover above EMA 50 on both time frame daily and weekly that means trend is up of stock and pulse is positive. Than we can go for long position.
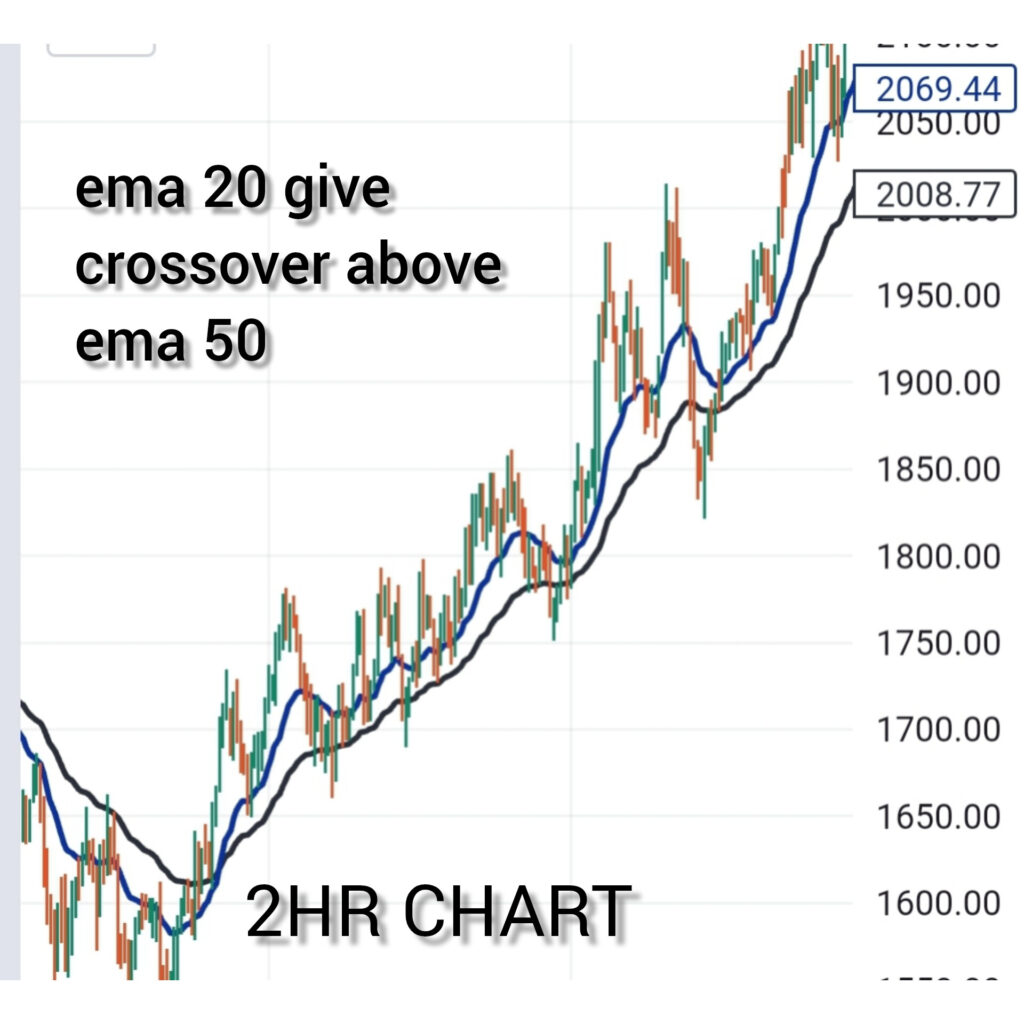
After you have check trend and pulse of stock on big time frame than move to 2hr time frame check here if EMA 20 give crossover above EMA 50 or not.
Than move to 15 minute time frame on chart. When EMA 20 give crossover above EMA 50 take ENTRY.
HOW TO EXIT
This type of trade can be intraday trade or maybe a swing trade depends on you. Because on all time frames stock trend is positive. So you can go long. If you take few trades in a month than you can go long until stock turn to a bearish trend.
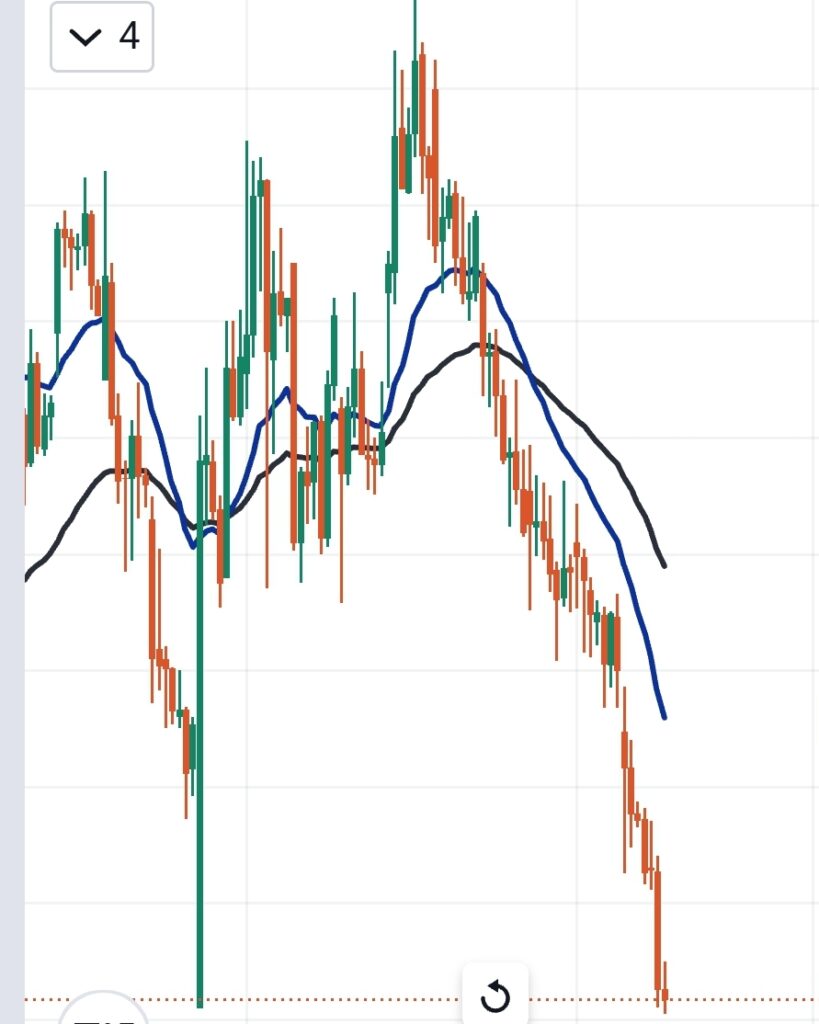
Otherwise if you take only for intraday tradethan hold trade untill on lower time frame on 5 minute EMA 20 give crossover from above to below to EMA 50. And stock turn to negative on 5 minute take exit from that point.
This strategy works very well but there is one Con’s is that You have to give time to screen in Intraday trading.You will be sit on chair in front of screen or chart untill stock turn to be a bearish mode on 5 minute time frame.You can not put stoploss in this type of trade.
What time frames are commonly used for EMAs?
Commonly used EMAs include the 12- or 26-day EMA, which are typically relied on by short-term traders, while the ever-popular 50-day and 200-day EMA is used by long-term investors.
What are the advantages of EMA?
Ability to respond quickly to price fluctuations.
Suitability for intraday trading.
Ability to identify trends in price movement.
Ability to be used in different time frames.
Can EMAs be used to identify support and resistance levels?
Yes, EMA’s can be used in combination with candlestick patterns to solidify a view about future direction of the script’s price. They may act as an added confirmation or confluence to have a stronger edge to generate a trading signal.
Is the EMA better than the SMA Day Trading?
Yes, the EMA is better than the SMA for day trading, as the EMA places greater weight on recent price movements. The EMA is thus more sensitive to recent fluctuations in prices, making it a more useful tool for intraday traders.
tradingwithview