


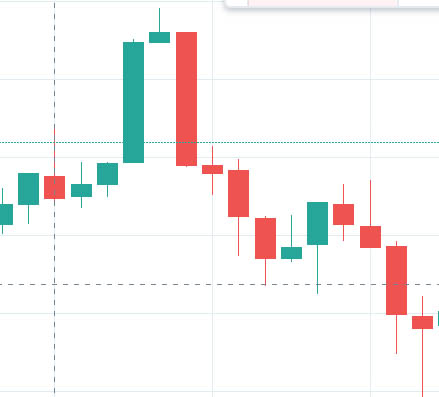
In this article we learn how to read candlestick charts. In the stock market, the price of a share is determined by its demand and supply among other factors. Candlesticks are a visual representation of the size of price fluctuations. Candles are helpful to find out demand zone and supply zone pattern and others information, that needed for a trader. Traders use these charts to identify patterns and gauge the near-term direction of price.
Candlestick charts can give you a variety of information if you understand patterns and trends. Using the knowledge of the different types of candlesticks can help you piece together patterns, which will lead to more successful and potentially profitable choices.
Financial technical analysis tools that depict daily price movement information that is shown graphically on a candlestick chart.
Formation of Candlestick Chart:
A candle is form from its body and wick. And this wick may be upper side or may be lower side of body.
So, the candle is divided into two parts:
- The Body
- Upper Shadow
- Lower Shadow


- Upper Shadow: The upper wick or shadow indicates the high trading session. If the upper shadow is longer, the asset price surpasses the open and close price. At the same time, a short upper shadow reflects asset trading close to its opening and closing price.
- Lower Shadow: The lower wick or shadow depicts the low trading session. If the lower shadow is long, then the asset price is on the lower side. On the other hand, a short lower shadow depicts asset prices that trade close to a low open or close point.
- The Body: The candlestick has a wide part called the “real body.” This real body represents the price range between the open and close of that day’s trading. When the real body is filled in or black (also red), it means the close was lower than the open. If the real body is white (or green), it means the close was higher than the open.
A candle has four different data points:

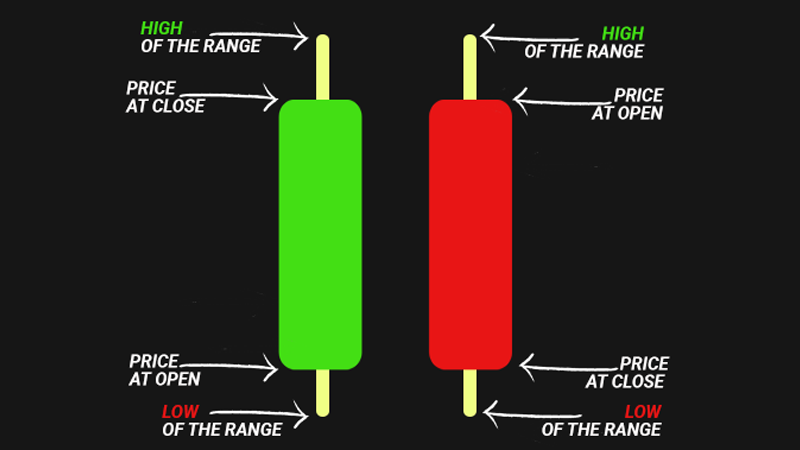
- Open: ‘Open’ is the price at which the asset trades at the very beginning of the intraday (or the given period).
- High: The top of the upper shadow or wick represents the high price point of an asset. However, if the asset opens or closes at its highest price, an upper shadow is not formed.
- Low: Similarly, the bottom of the lower shadow reflects the low price point of an asset. Again, if the price opens or closes at its lowest, the lower shadow is absent.
- Close: It is the closing price at which the last trade is made at the end of the intraday or the given period.
This is basic knowledge about candles in trading. In market there are thousands of patterns and strategy by which common people make money. Several times they make money and several times they fail to make money. We are not recommending those pattern and strategy for you; we focus in three strategies in market.
How to use candlesticks when trading
Now, based on above information we divide candles in two categories:
1.Filled order candle: A candle that has body size greater than 70% of its total size, called as filled order candle. The color may be green or red of filled order candle.


2.Unfilled order candle:
A candle that has wick size greater than 50% of its total size of candle, called as unfilled order candle.The color may be green or red of filled order candle.


Unfilled order candle contain pending orders of professional traders and public orders, and filled order candle length decides targets for order.
Body of the candlestick
The body of a candlestick is used to show the difference between an asset’s open and close price (or the current price for the candlestick on the far right). If the candlestick is green, then the bottom of the body represents the opening price and the top represents the closing price. If the candlestick is red, then the opposite is true, and the top represents the opening price and the bottom represents the closing price.
Equally, if the body of the candlestick is long then there has been a period of intense buying and selling. If the body of the candlestick is short, then there has been more of a consolidation in the market for that period.
Wick of the candlestick
The wick or ‘shadow’ of the candlestick shows the highest and lowest prices reached by an asset in the given time period. The top wick, also known as the upper shadow, is the highest price. The bottom wick, or lower shadow, is the lowest price.
A candlestick with a long upper wick and short lower wick shows that buyers were very active during a trading period. However, sellers soon forced prices to fall from their highs, causing the markets to close lower than the level which the upper wick reached. The weak closing price created the long upper shadow.
Conversely, a candlestick with a long lower wick and short upper wick shows us that sellers drove prices lower initially, but then buyers bought cheap and caused prices to recover, with the markets finishing strongly as evidenced by the long lower shadow.
We will teach you at this website three types of earning money strategy from market.
1. Trading at demand zone2. Momentum trading3. Investing for short time