


We will discuss Supply and Demand Zone Concept in Trading in this article. Not in trading every business in world works on supply and demand concept. You know when demand of any item is increase price of product increase, and when supply increase product price fall. This concept is valid in every market, digital and physical both.
A supply zone is established when the market is poised for a downtrend, meaning there’s an excess of goods or securities available and prices are set to decrease.
Conversely, a demand zone forms when the market is on the brink of an uptrend, indicating that there’s a heightened interest or demand and prices are likely to rise. Identifying these zones is essential for traders who want to predict and benefit from future market shifts.
Supply and Demand trading strategies use price returning to these zones as entry and exit criteria. The strategy is market-neutral – meaning it can be traded in forex markets, commodity futures, index CFDs etc.
Market Structure
Let’s think about the three simplest concepts in trading financial markets
- When demand is greater than supply, the price goes up.
- When demand is equal to supply, the price goes sideways.
- When supply is greater than demand, the price goes up down.
Above these three rules are core points in trading strategy.
Why Do Supply and Demand Zones Form?
As retail traders, we don’t have the power to move the market, that power only belongs to the banks and other institutional traders, whose buying/selling orders prowess can cause reversals and set off large trends in market. Supply and demand only changes when banks start buying or selling.
But these professional traders and banks, These market movers can’t enter all at once. Their trades are too colossal! With enormous positions to enter, the banks cleverly divide them into manageable portions, executing each trade separately at similar price points. This strategy sidesteps the risk of slippage, ensuring their subsequent entries don’t get placed at worse prices!
In effect, they enter a massive trade by placing smaller positions.
But here’s the problem:
These massive positions are such a handful that finding enough opposing traders to take the other side is a real challenge—even when broken down into bite-sized pieces!
Banks need thousands of opposing traders to execute trading actions:
- For buying, they require masses of sellers.
- For selling, they need masses of buyers.
Than What FII and Banks do at zones.
- Place their initial positions using the available orders.
- Wait for price to return to the same point after the reversal.
- Enter their remaining positions to cause the main reversal.
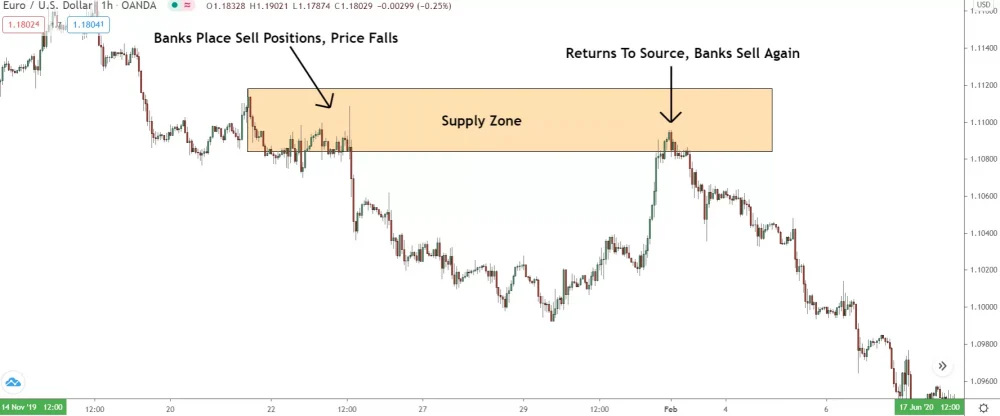
that process looks like this at supply zone…

And at demand zone they do like this…

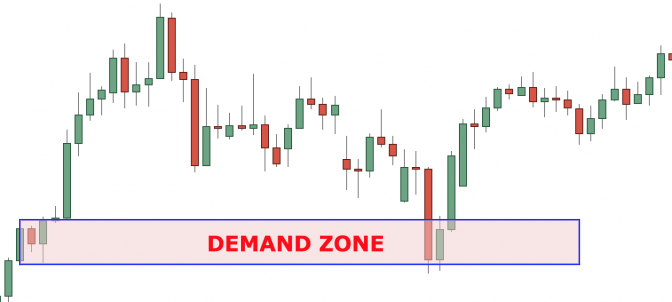
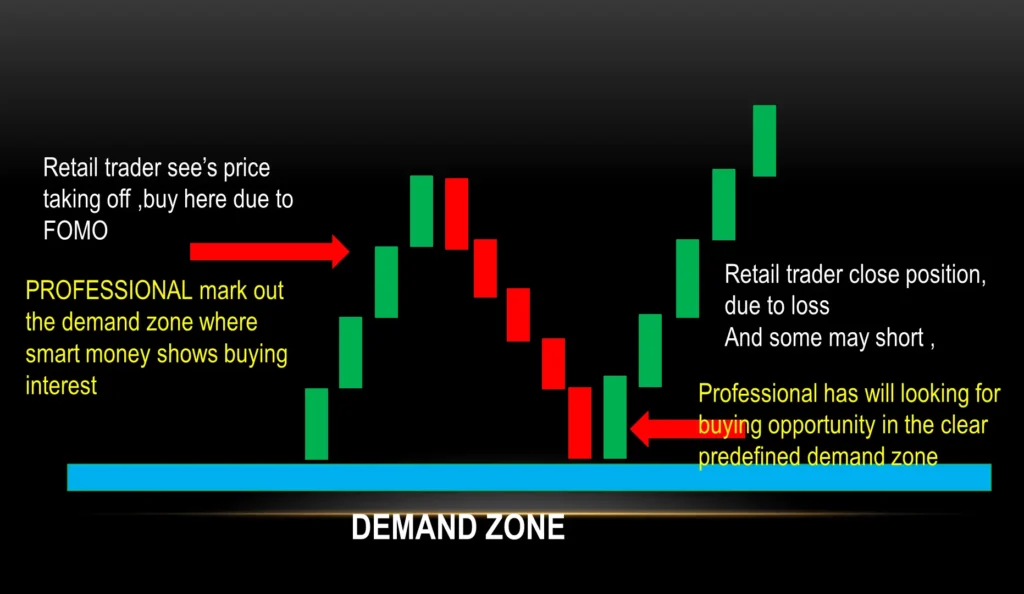
Demand Zones form when the banks place a large number, or size, of buy positions. This creates excess demand, and results in the price reversing and moving higher.
The point where price reverses is the demand zone.
How Banks & FII strategy works at zones
First: The banks place what positions they can, and price shoots away.
Next: Banks maneuver price back to the source, where they initially established their position. By doing so, they can add any remaining positions (trades) at a comparable price, essentially emulating the placement of a single, massive position in the market.
Then: The banks can allow price to fully reverse, and a large move ensues.
Using the supply and demand strategy, your job is to locate and trade these points where the banks enter their trading positions.
These are called: supply and demand zones.
These zones form at points where large price reversals take place, as the balance of supply and demand shifts changes from the banks entering massive positions.
Price moves from supply zones to demand zones and back: over and over again.
This is supply and demand trading in action! Once you understand the psychology of these big traders then this a great business for you in the world for making money.
Making money in market is very simple if first you do work on yourself for learning.
Key Characteristics Of Demand Zones:
- Historical Price Reversal: Demand zones often occur where price has previously reversed from a downtrend to an uptrend. This previous reversal suggests that the demand zone may be a point at which banks enter buy trades to make price reverse.
- Price Consolidation: Demand zones often coincide with areas of price consolidation, where price has moved sideways before a sudden increase in demand (buying) drove the price upwards.
- Volume: Increased trading volume can often be seen at demand zones as the increased number of buy orders leads to increased trading activity. However, this is not always the case, and a demand zone can still exist even if there isn’t a noticeable increase in volume.
- Support Level: A demand zone can act as a support level, where price struggles to fall below due to a concentration of buy orders. If price does break through a demand zone, it can be a bearish sign.
- Wicks into the Zone: Candlestick charts often show wicks entering the demand zone, indicating a rejection of lower prices. This demonstrates that each time price enters this zone, buying pressure overwhelms selling pressure and pushes price back up.
- Price Acceleration: When the price reaches a demand zone, it often rises quickly due to the abundance of demand and the lack of supply.
- Fresh Zones: The best demand zones are “fresh,” meaning price has not returned to them since they were created. Every time price returns to a demand zone, some of the demand (buy orders) gets filled, reducing the strength of the zone.
- Event-Based Demand Zones: These are formed due to a particular event such as earnings announcements, economic news, etc., causing a sudden increase in demand.
Key Characteristics Of Supply Zones:
- Historical Price Reversal: A supply zone typically refers to an area on the chart where the price has previously reversed direction from an upward trend to a downward trend. This historical reversal suggests that the area might be a point at which sellers enter the market in force.
- Price Consolidation: Often, supply zones are identified around areas of price consolidation. These are periods where price has moved sideways, suggesting a balance between supply and demand, before a sudden increase in supply (selling) pushed the price downwards.
- Resistance Level: A supply zone can act as a resistance level. If price returns to this level after a period of rising, it can struggle to break through due to the abundance of sell orders. If price does break through, it can be a sign of a strong upward trend.
- Wicks into the Zone: A supply zone is often characterized by candle wicks poking into the zone, reflecting a rejection of higher prices. These wicks indicate that every time the price enters this zone, selling pressure overwhelms buying pressure and pushes the price back down.
- Volume: In some cases, there might be an increase in volume at the supply zone, as the increased number of sell orders leads to an increase in trading activity. However, this isn’t always the case.
- Price Acceleration: Within the supply zone, or immediately after it, price often falls quickly. This rapid price decline represents an abundance of supply and lack of demand.
- Fresh Zones: The best supply zones are “fresh,” meaning the price has not returned to them since they were formed. Each time price returns to a supply zone, it consumes some of the supply, and thus the zone is weakened.
- Event-Based Supply Zones: These are formed due to a particular event such as earnings announcements, economic news, etc., causing a sudden surge in supply.
Pro Tip: ” Want to find high probability S&D zones? Look for major swing highs and lows! Major swing highs and lows signal a massive shift point in the market – a tell tale sign the banks have entered significant positions, and created a supply or demand zone.”