

In this post we will learn how to do Trading with 50 day moving average that multiply your portfolio in short term. Well, imagine having a trusted companion by your side—the 50-day moving average.

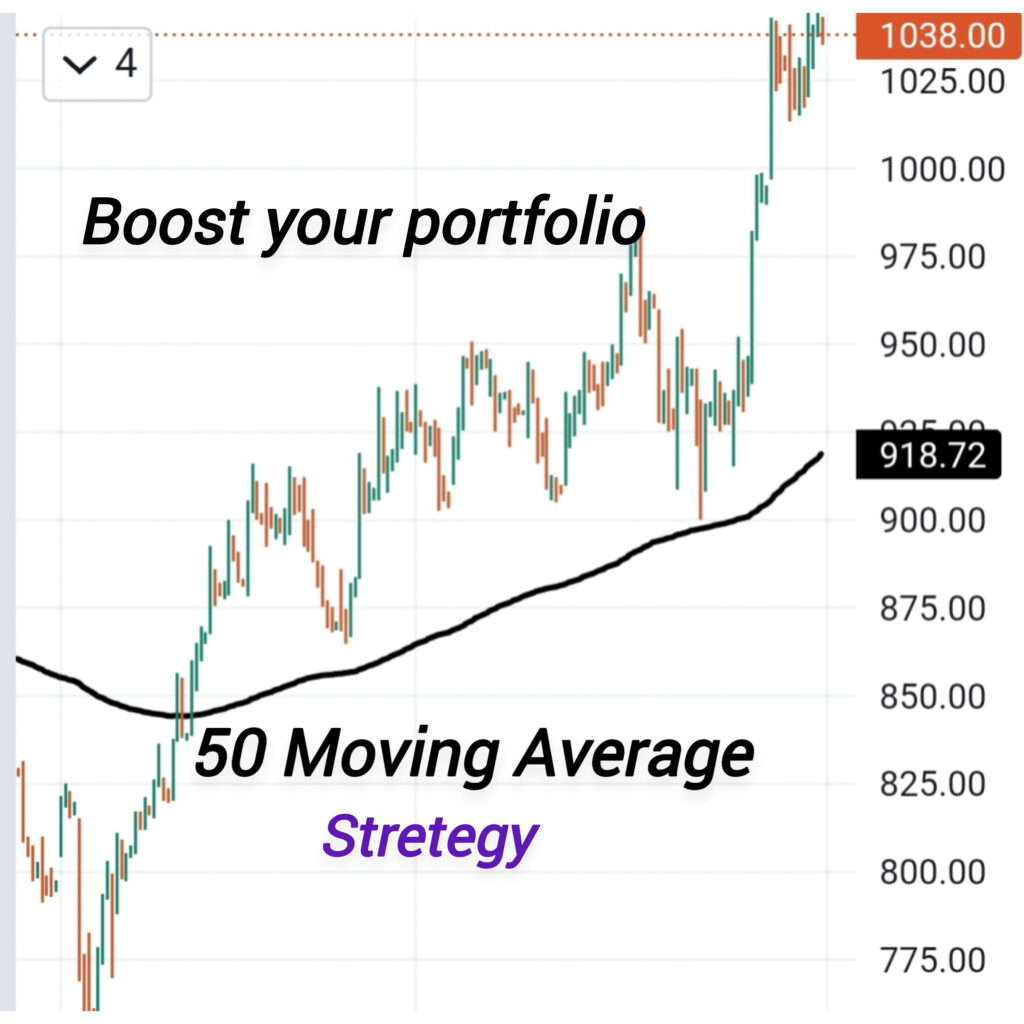
It’s like having a reliable trading partner who can read the market’s mind. 50 day moving average can be used in both short and long term trading strategies. It works on very simple approach,When price goes above 50 MA than 50 MA works as support for price. And when price cross below 50 MA than 50MA works a resistance for price.
Now, let’s dive into the strategy itself.
The 50-day moving average acts as a magical line that smooths out the noise of daily price fluctuations and reveals the underlying trend.
It’s like finding the melody amidst a cacophony of market chaos.
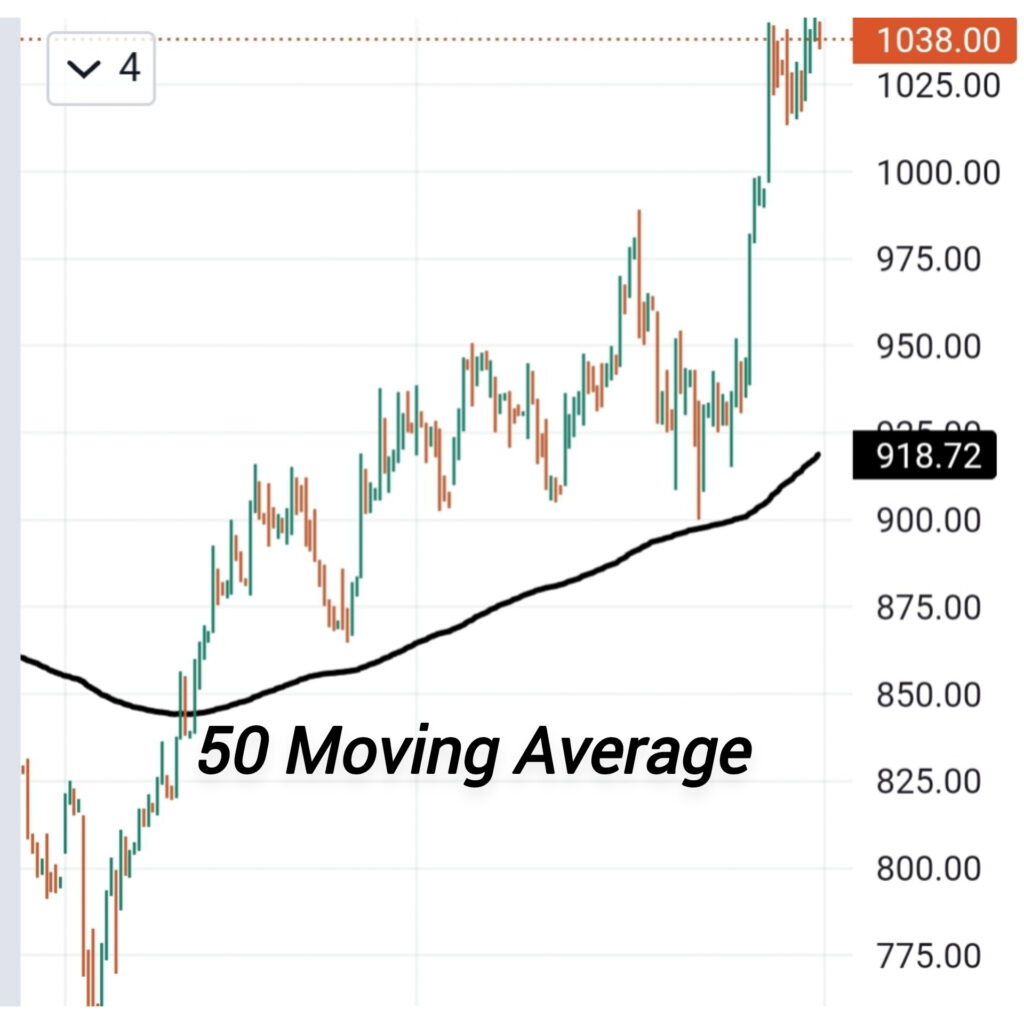
Here’s how it works: When the price crosses above the 50-day moving average, it’s a bullish signal, indicating that the trend is potentially turning in your favour.
It’s like a green light on the trading highway, urging you to step on the gas (or place those buy orders, to be more precise).
Here is an example:
Conversely, when the price dips below the 50-day moving average, it’s a bearish signal, suggesting that the trend might be shifting against you.It’s like a red flag waving in front of a bull (metaphorically, of course).Time to tighten those seatbelts and consider some protective measures.
Here is a bearish example:
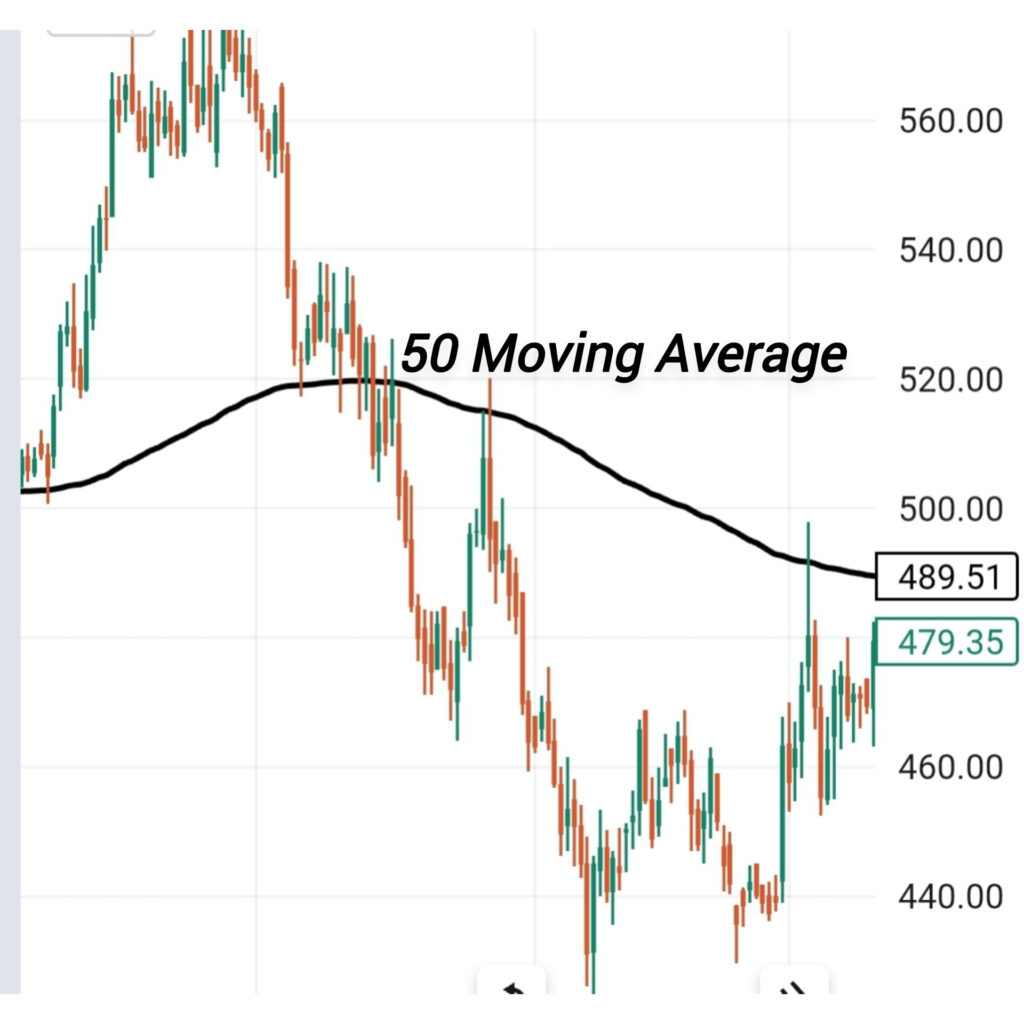
Here, you can see there were two opportunities to sell.You might or not have been stopped on the first one, depending on how tight your SL is.
But wait, there’s more!
The 50-day moving average isn’t just a one-hit wonder. It can also act as dynamic support or resistance levels.Picture this:When the price approaches the 50-day moving average from below, it’s like a trampoline propelling it higher, giving you a chance to ride the trend with confidence.
Now, you might be wondering, “Does this strategy actually work?”
Well, let me share some mind-blowing statistics with you.In a comprehensive analysis of historical data, the 50-day moving average strategy has shown an average success rate of 70% for identifying profitable trends.
Yes, you read that right—70%!
50-DAY VS 200 DAY MA
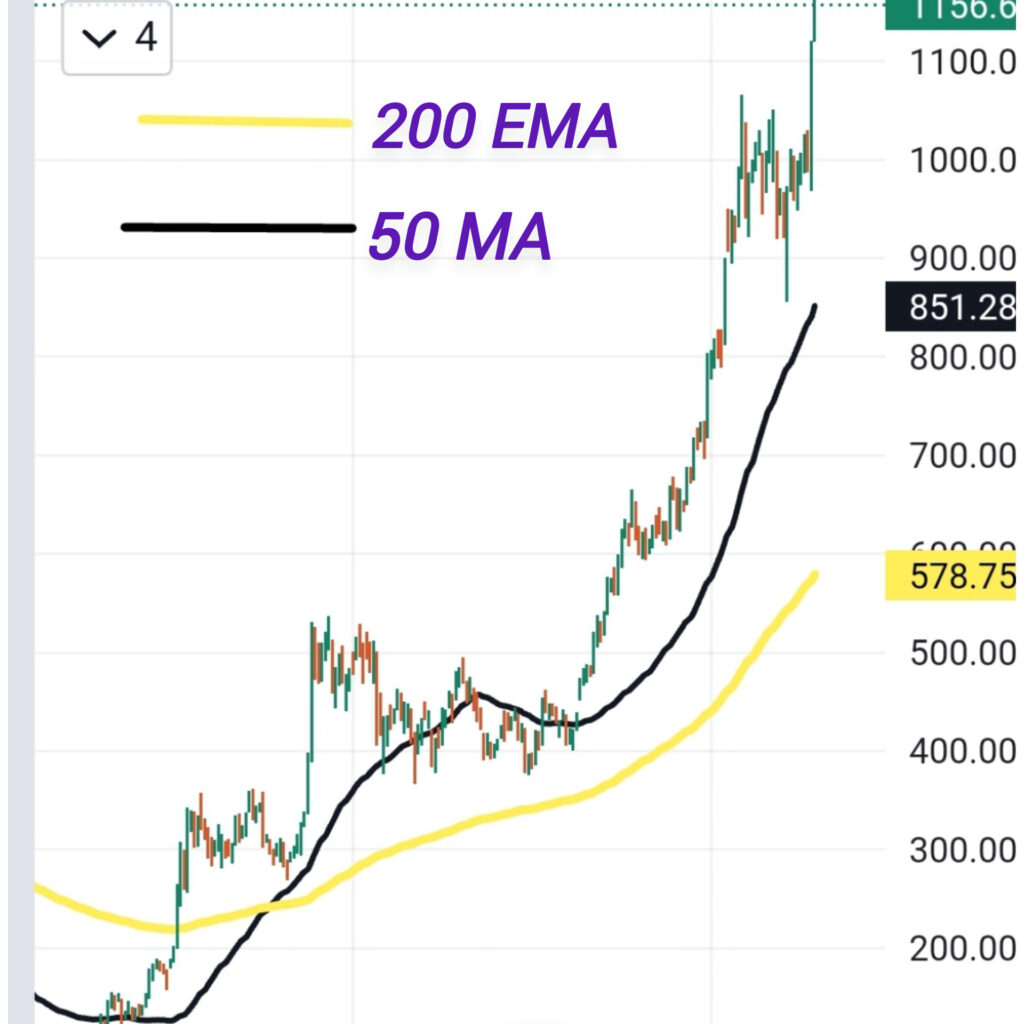
But hey, let’s not forget about its big brother, the 200-day moving average.While the 50-day moving average offers nimble insights into shorter-term trends, the 200-day moving average takes a broader view.It’s like comparing a cheetah to a wise old elephant.
Both have their strengths!
Historical analysis reveals that the 200-day moving average strategy boasts an average success rate of 65% for capturing longer-term trends. While slightly lower than the 50-day moving average, it’s still an impressive statistic that showcases the power of this strategy.
It’s like having two trading superheroes on your side—each with its unique superpowers!
So, with the Marvelous 50-Day Moving Average Trading Strategy, you get a winning edge in shorter-term trends, while the 200-day moving average covers the longer-term perspective.
It’s a dynamic duo that has the potential to unlock profitable opportunities and keep your trading game strong. Are you ready to seize the market with this winning combination? Put on your trading cap, buckle up, and get ready to make those moving averages groove to your tune!
You may also interested…
How to improve my trading skills
Importance of Supply & Demand Zone Trading
FAQs: 50-Day Moving Average
1. What is a 50-day moving average?
- Answer: A 50-day moving average (50-DMA) is a technical analysis indicator that calculates the average closing price of a security over the past 50 trading days. It is used to smooth out price data, providing a clearer view of the market’s trend over a medium-term period.
2. How is the 50-day moving average calculated?
- Answer: The 50-day moving average is calculated by adding the closing prices of a security for the last 50 days and then dividing that sum by 50. This calculation is updated daily to reflect the most recent 50-day period.
3. Why is the 50-day moving average important?
- Answer: The 50-day moving average is important because it is widely regarded as a key indicator of medium-term market trends. Many traders and investors use it to identify the general direction of an asset’s price movement and to spot potential entry or exit points.
4. What does it mean when a stock crosses its 50-day moving average?
- Answer: When a stock’s price crosses above its 50-day moving average, it is often interpreted as a bullish signal, indicating that the stock may be gaining upward momentum. Conversely, if a stock’s price crosses below the 50-day moving average, it is typically seen as a bearish signal, suggesting potential downward momentum.
5. How is the 50-day moving average different from the 200-day moving average?
- Answer: The 50-day moving average represents a shorter time frame and is considered a medium-term indicator, while the 200-day moving average covers a longer time frame and is often used to identify long-term trends. The 50-DMA is more sensitive to recent price changes, making it useful for detecting trend reversals earlier than the 200-DMA.
6. Can the 50-day moving average be used alone for trading decisions?
- Answer: While the 50-day moving average can be a useful tool, it is typically not used in isolation. Traders often combine it with other technical indicators, such as the 200-day moving average, RSI, or MACD, to confirm signals and reduce the risk of false positives.
7. What are common trading strategies involving the 50-day moving average?
- Answer: Common strategies include the “Golden Cross” and “Death Cross.” A Golden Cross occurs when the 50-day moving average crosses above the 200-day moving average, signaling a potential bull market. A Death Cross occurs when the 50-day moving average crosses below the 200-day moving average, indicating a possible bear market.
8. What are the limitations of the 50-day moving average?
- Answer: The 50-day moving average, like all moving averages, is a lagging indicator, meaning it is based on past prices and may not react quickly to sudden market changes. It can also produce false signals in volatile markets, where prices frequently cross above and below the moving average.
9. How do I incorporate the 50-day moving average into my trading strategy?
- Answer: To incorporate the 50-day moving average, you can use it to identify trends and set stop-loss levels. For example, if you are in a long position, you might set a stop-loss just below the 50-DMA to protect against potential downturns. Additionally, look for crossovers with other moving averages as part of a broader trading strategy.
10. Is the 50-day moving average suitable for all types of assets?
- Answer: The 50-day moving average can be applied to various types of assets, including stocks, commodities, and cryptocurrencies. However, its effectiveness may vary depending on the asset’s volatility and trading patterns. It is essential to backtest the indicator on specific assets to gauge its reliability.